Website Usage Visualisation
Data Visualisation // Fun
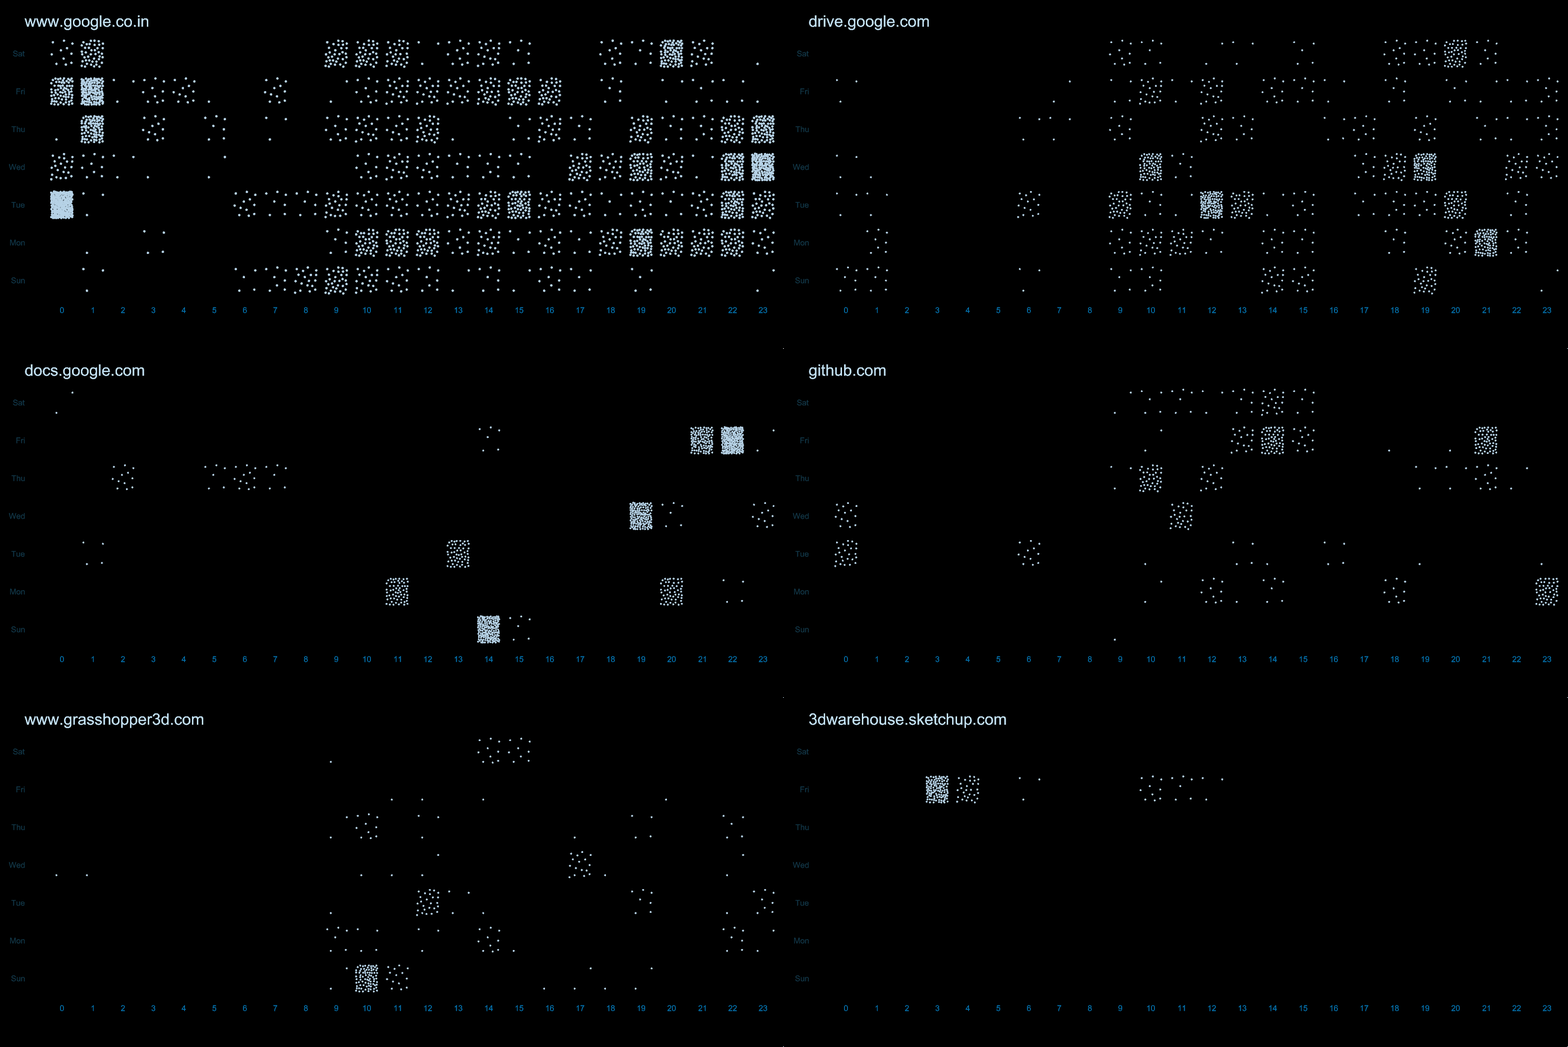
Browser history of a short period extracted using chrome API and visualised using grasshopper. X-axis is hour of the day, Y-axis is day of the week.
Data Visualisation // Fun
Browser history of a short period extracted using chrome API and visualised using grasshopper. X-axis is hour of the day, Y-axis is day of the week.